
Capacity Analysis |

|

|

|
|
Capacity Analysis |

|

|

|
|
|
||
The Capacity Analysis utility calculates the average weekly room hour utilization, prime time utilization, and seat fill data for each room, as well as the on-grid (standard, non-overlapping) and off-grid utilization of meeting patterns (including non-standard pattern wasted hours) for a specified term.
Dashboards that display average weekly utilization of rooms require this analysis data. Therefore, prior to viewing Astra Schedule dashboards, it is recommended to run the Capacity Analysis to populate this utilization data.
There are a few configuration steps that must be completed before running the Capacity Analysis. These configurations provide key term, meeting pattern, and room grouping input for the analysis process.
For meeting pattern utilization, the system must know which group of meeting patterns represents your on-grid patterns. This is a group of your most commonly used, standard, non-overlapping meeting patterns.
For room region utilization, the system must know the single, master region to which each room should belong for utilization reporting purposes. The dashboard will use the reporting region as a grouping element for room utilization.
The following configuration steps are required before running Capacity Analysis:
•Create a Capacity Analysis Times definition
This process infers Prime Time Hours, Standard Week Hours, and On-Grid Meeting Patterns from your data.
•Calculate Term Weeks
This process derives term weeks from the standard course offering dates, but may be edited as needed.
•Verify Room Size Categories
Standard room size categories for dashboards and report are provided by default. Verify that the standard categories do not require editing.
•Edit the Reporting Region for rooms.
A master reporting region must be selected for all rooms that should be included in utilization reports.
Create a Capacity Analysis Times Definition and Verify Inferred Prime Time Hours, Standard Week Hours, and On-Grid Patterns
The Capacity Analysis Times utility analyzes existing section data and infers prime time and standard hours per day and week, as well as “on-grid” meeting patterns.
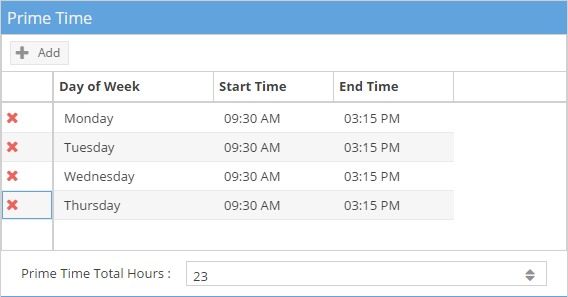
•Prime time = % of most utilized time block in analysis (in # of sections) using that time block is 50% or greater.
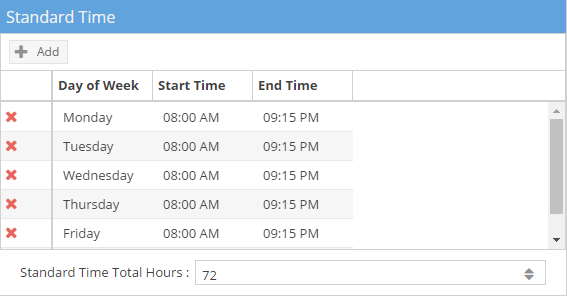
•Standard time = range of earliest start time to latest end time, minus Saturday/Sunday
NOTE: Daily start and end times are rounded up/down to nearest 30 min mark.
•On-grid patterns = the most commonly used, non-overlapping patterns per day that overlap the prime time range
A heat map is provided to help visualize the patterns in the data analyzed. You may edit the inferred information to override the system as desired.
Multiple Capacity Analysis Times results can be generated as needed to model these time standards using different input parameters. A list of Capacity Analysis Times results is provided to manage these.
To create a new Capacity Analysis Times run, perform the following:
1.Make sure your user has permission to view the “KPI Dashboard”.
2.Click Capacity Analysis Times on the Admin option list on the Analytics tab to display the list page.

3.Click Add.
4.Enter a name for the Times record, select a term from the drop-down list, and select the relevant campus and or room type records for which you would like to analyze time usage. These parameters filter the section data used for the times analysis.
NOTE: Sections for the selected term must have “actual enrollment” values.
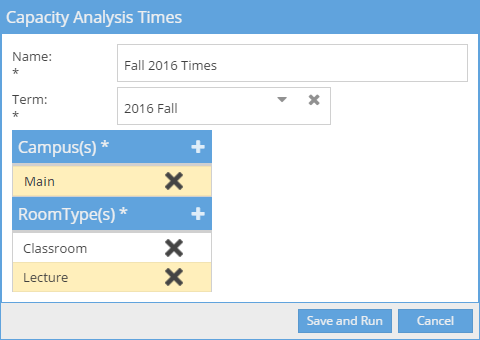
5.Click Save and Run.
6.The system will return to the list page and queue up the analysis job to run as a background task. The status will change to “Completed” when finished.
7.Click the name of your Capacity Analysis Times record to view the results.
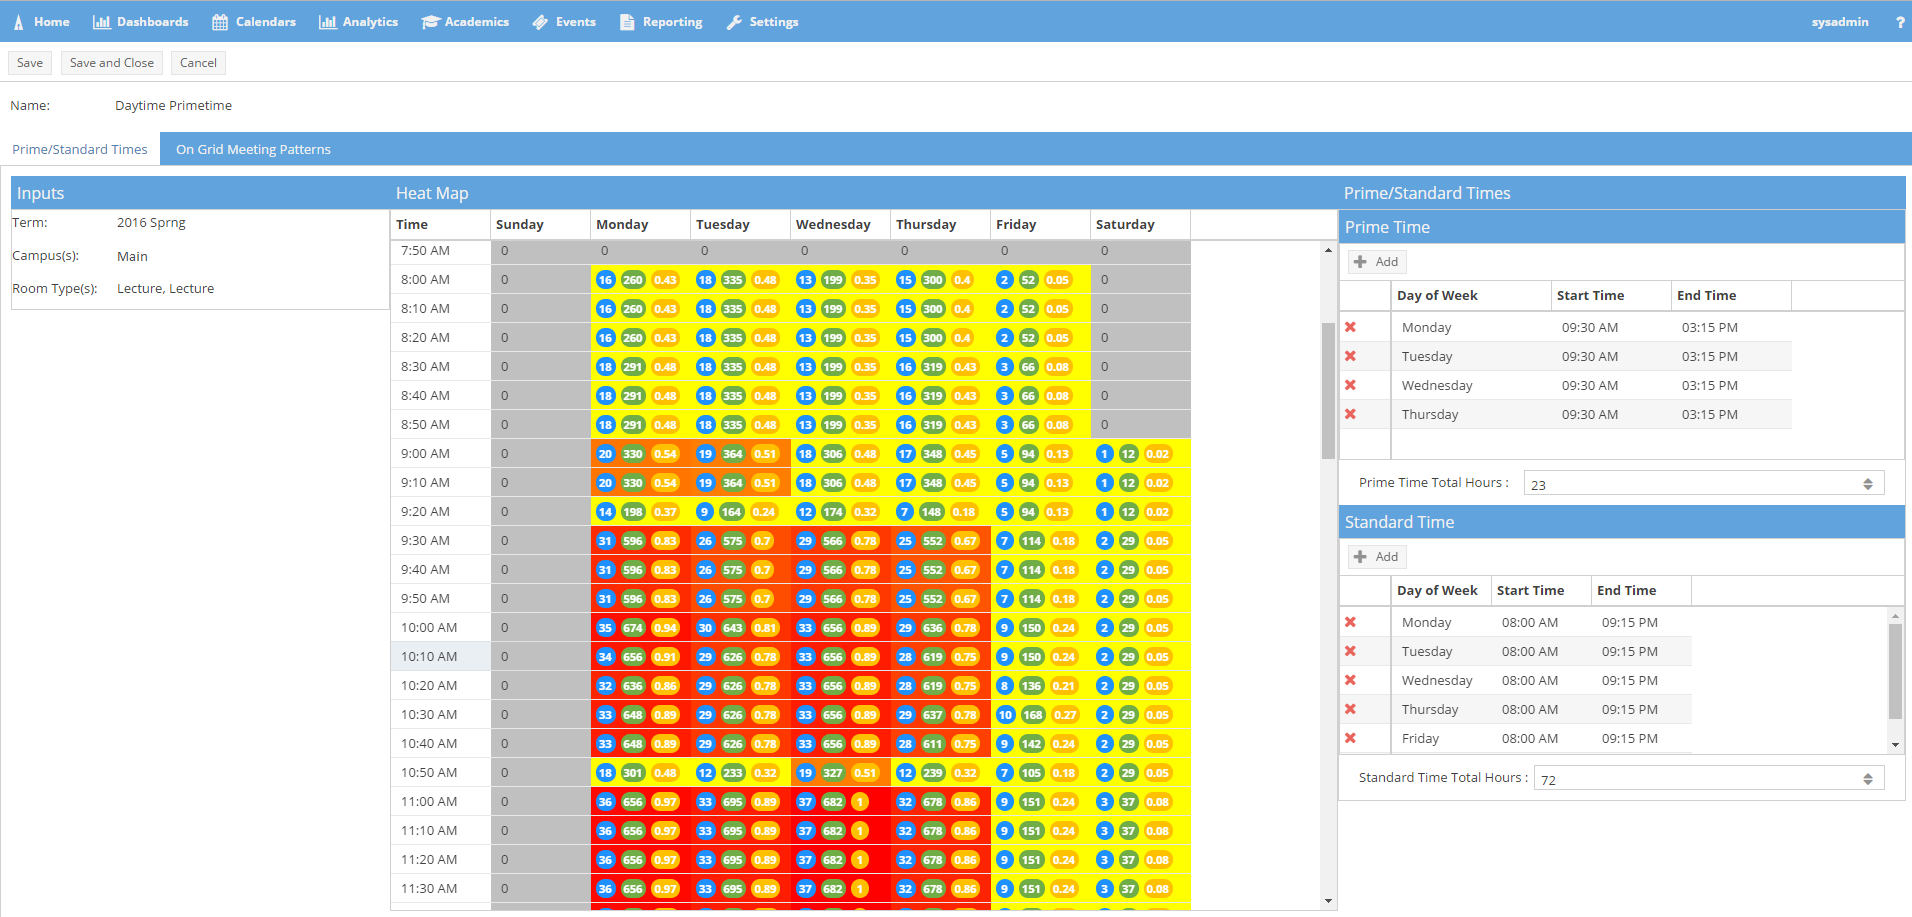
8.A heat map is provided for at-a-glance feedback on the density of time usage within the sections analyzed. Yellow indicates the least used times; Red indicates the most used times.
Each cell includes indicator numbers for:
Total count of sections found at that time
Total enrollment of sections
Heat calculation (number of sections/max number of sections in any one block)
9.Inferred prime times and standard times per day, and total hours per week are listed in a grid on the right. You may use the Add and delete options in this grid to edit the days and times included. Additionally, you may edit the total week hours if desired.
10.Click the On-Grid Meeting Patterns tab at the top of the results page to view a list of all meeting patterns utilized in the analyzed data. For each pattern, the system will display the number of sections that used the pattern, whether the pattern overlaps the prime time range, and whether the pattern is considered on grid. Meeting patterns determined to be “on grid” are flagged and sequenced in chronological order for reporting purposes. Finally, the on grid patterns included in the definition are added to a Meeting Pattern Group that the system will use for Capacity Analysis.
“On Grid” patterns are meeting patterns used by sections in the analyzed data that:
Are most commonly used, per day, by section count.
Are non-overlapping per day.
Overlap the inferred prime time range.
The “on grid” flag is editable, so you may add or remove patterns in the on grid group if desired, as long as they are non-overlapping.
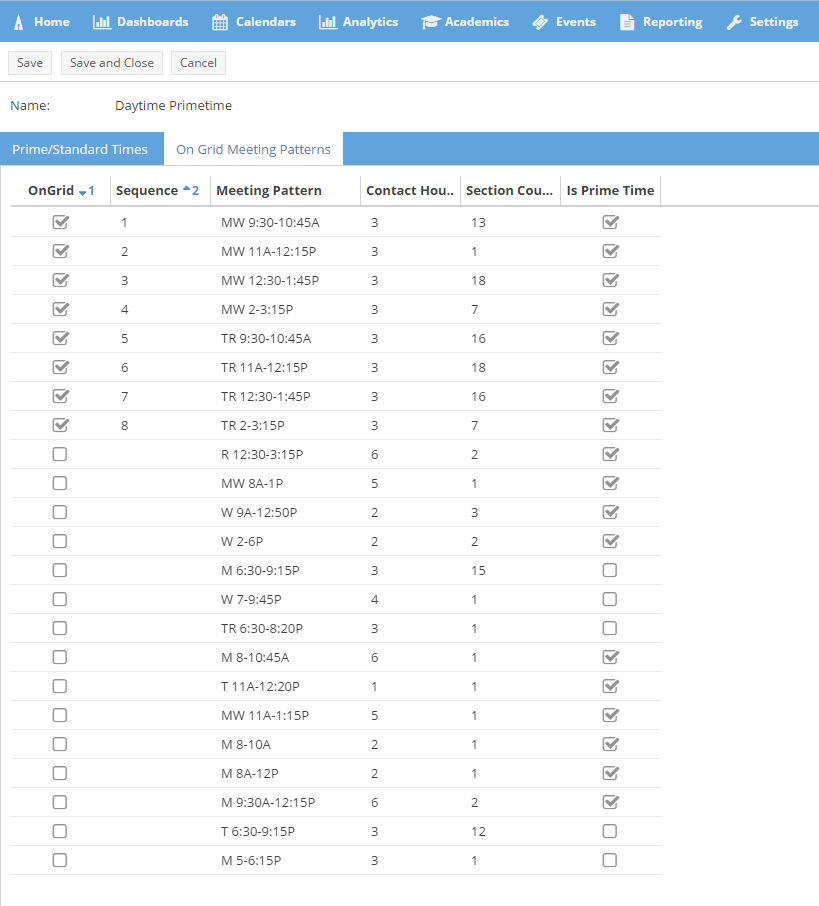
Old or obsolete Capacity Analysis Times records may be deleted from the list page if a) it is not in the process of running, and b) it was not used as the basis for a Capacity Analysis run (this must be deleted first).
Calculate and Validate Term Weeks on Term Record
The system will analyze the start and end dates for existing sections for the term, find the most common start and end dates, and determine the number of weeks in that range.
1.Open the term record you wish to update.
2.Click the Analysis Term Settings tab at the top of the term form.
3.In the Capacity Analysis section, click Calculate Dates.
4.The system will determine the start and end dates and number of weeks in the term based on the section data as opposed to the term definition. It also creates a list of unique start and end dates and the count of their occurrences for validation purposes. This can take a few moments.
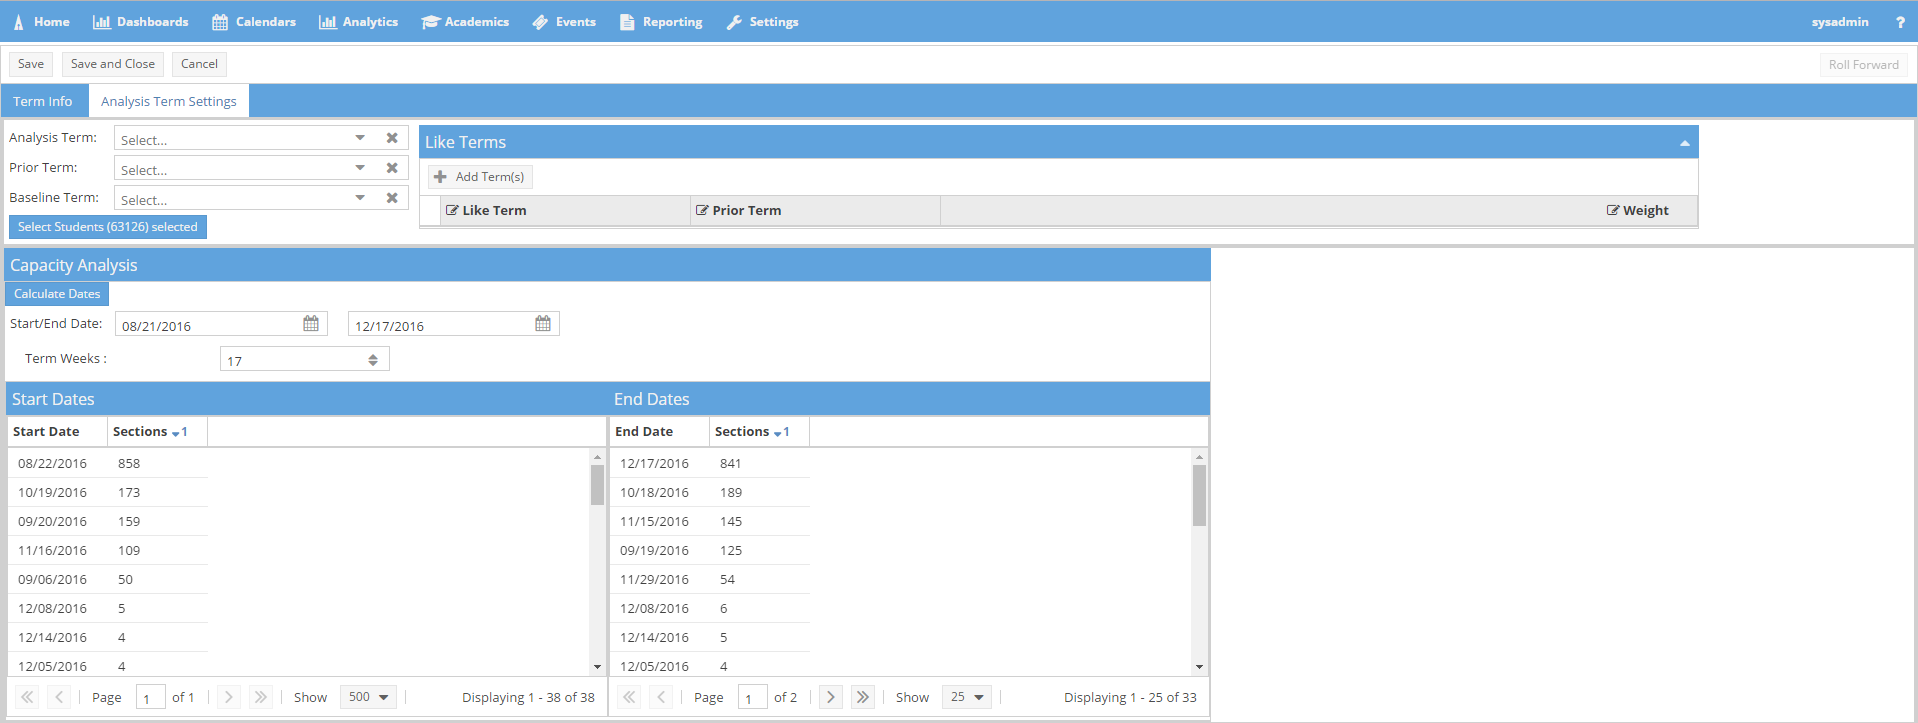
5.When the system is finished, you may make manual changes to the dates or number of weeks if desired.
This may be desired to include exam week or to start the term on a full week if it officially started mid-week (to avoid having a partial week utilization).
Click Save to save the results.
Verify Room Size Categories
Room size categories are used by the dashboards to present information grouped based on room capacity. A list of standard categories is included by default, but these may or may not align with your institution’s standard room sizes.
Verify that the room size categories will meet your needs.
1.Click Room Size Categories in the Admin section of the Analytics tab.
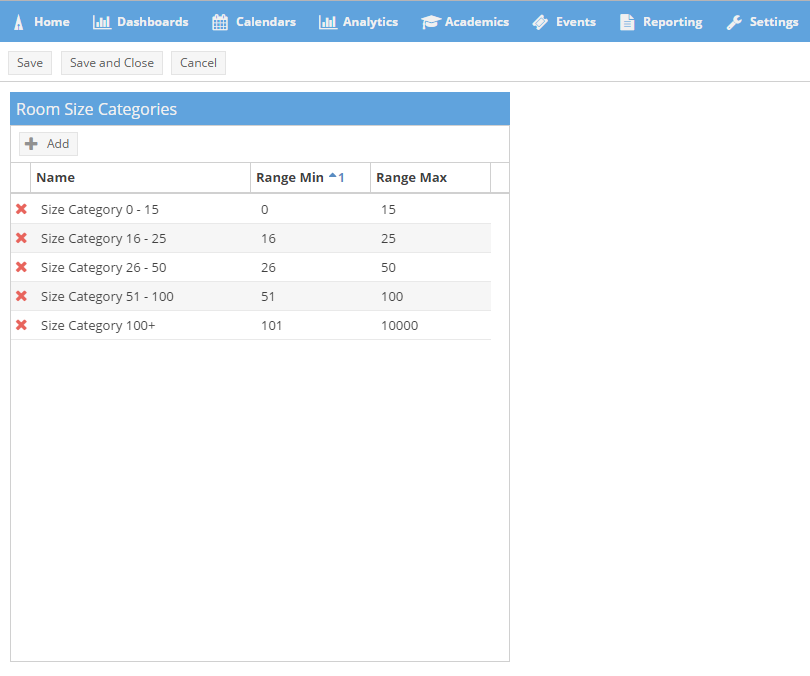
2.The name, min, and max fields can be edited in the list as needed.
3.Rows may be added or removed.
4.Note that when modifying the room size categories, the size ranges cannot overlap.
Configure Master Reporting Region
To configure the master reporting region for rooms, perform the following:
1.Click the Rooms option on the Settings tab.
2.Click on a room on the room list.
3.In the Regions section of the room form, use the drop down menu to select an appropriate master reporting region for the room.
![]()
4.Click Save to save changes. Repeat this process for all rooms within regions that require dashboard utilization reporting.
The Capacity Analysis setup process uses term weeks, standard and prime times, and on-grid patterns from the term and Capacity Analysis Times data created previously.
To generate a Capacity Analysis, perform the following:
1.Click on the Capacity Analysis option in the Admin section of the Analytics tab.
2.Click the button to Add a Capacity Analysis.
3.In the Capacity Analysis form, enter a descriptive name for this analysis. (i.e. "Fall 2017")
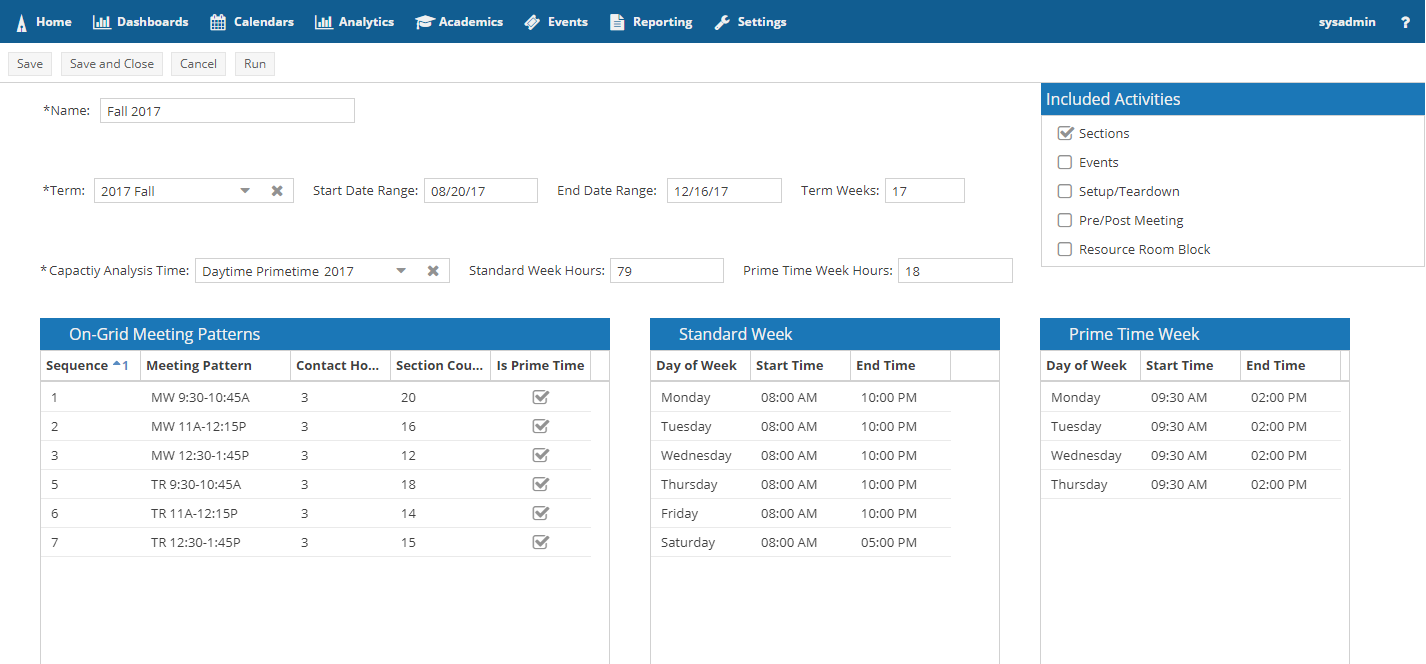
4.Select the Term to be analyzed from the drop-down list.
The start and end dates and term weeks will be populated automatically.
5.Select a Capacity Analysis Times record from the drop-down list.
On-grid patterns, and Standard and Prime Time week hours and times will be populated automatically.
6.Check the box next to the activity types that you would like included in the analysis.
7.Click Save.
8.Click Run to start the Capacity Analysis. Please allow a few minutes to complete the analysis.