After completing this unit, you’ll be able to:
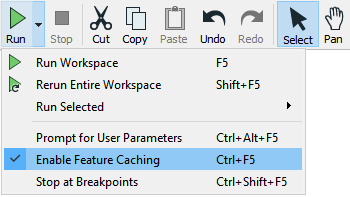
Sometimes it's important to be able to inspect data at any step of the translation. You can view data as you work in FME Workbench by enabling feature caching mode using Run > Run with Feature Caching on the menu bar:
With this option active, FME generates caches at every step of the translation when the workspace is run:
The caches are indicated by the small icons on each object. In the above screenshot, the caches are green, but if any parameters change that could affect the data in the cache, they turn yellow. Yellow caches are considered invalid; you can still inspect them, but their data may no longer accurately represent the results of the translation.
Inspecting Cached Data
With Toggle Automatic Inspect on Selection enabled, if you click a feature type or transformer with a cache, it will automatically be displayed in Visual Preview (covered in the next section):
Map tiles by Stamen Design, under CC-BY-3.0. Data by OpenStreetMap, under CC-BY-SA.
Specific data caches (for example a single output port on a transformer) can be inspected by clicking on the feature cache icon:
Inspecting data this way can allow you to quickly debug and develop workspaces, but keep in mind that if you are inspecting a large number of features or features with complex geometry, the caching required for automatic inspection might introduce performance challenges.
Partial Runs
When caching is turned on, running a translation causes data to be cached at every part of the workspace. In subsequent runs, those caches can be used instead of having to re-run entire sections of the workspace.
Here, for example, a workspace has been run with caching turned on:
Now the author makes a change to the AreaCalculator parameters:
Notice that the caches change color (to yellow) on the AreaCalculator and subsequent transformers. This color denotes that caches are stale; their data contents no longer match what the workspace would produce.
To get the new results, the author must re-run the workspace. However, they do not have to re-run the entire workspace; they can start the workspace at the point of change - the AreaCalculator:
Several options for partial runs exist depending on the object’s location on the canvas:
When using partial runs, FME will use data from caches where possible instead of re-running objects. Notice how hovering over the Run From This partial runs button causes all "downstream" transformers to be highlighted. They are the only ones that will be run. That makes the translation quicker.
Using Run To This looks upstream to find a valid cache and runs from that. Here is an example showing using Run To This on a writer feature type:
...but notice how the second branch from the StatisticsCalculator does not get highlighted. It will not be run. That shows how you can avoid running a particular section of workspace, in much the same way as if that connection had been disabled.
Visual Preview is an embedded version of FME Data Inspector that displays features in a Workbench window. Many - but not all - of the features available in the stand-alone Data Inspector application are available in Visual Preview.
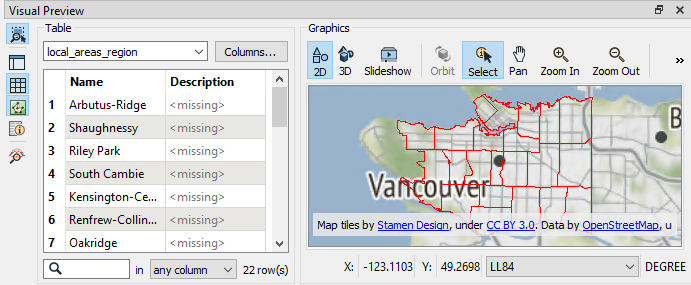
Visual Preview lets you inspect a single view of your data directly in Workbench as you build your workspace:

Map tiles by Stamen Design, under CC-BY-3.0. Data by OpenStreetMap, under CC-BY-SA.
Viewing Data in Visual Preview
You can view features in Visual Preview in these ways:
Right-click on a feature type in the Navigator or Workbench Canvas, and select View Source Data:
On the canvas, click the View Source Data icon on the mini-toolbar over a feature type or some transformers:
Run a workspace with feature caching enabled and then select cached objects:
Map tiles by Stamen Design, under CC-BY-3.0. Data by OpenStreetMap, under CC-BY-SA.
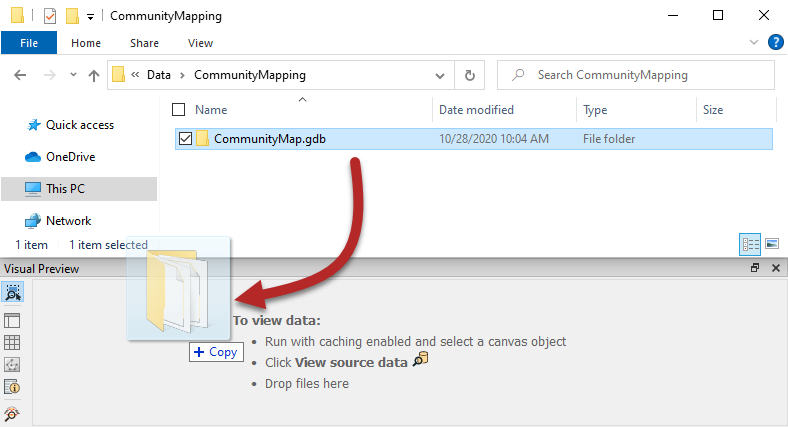
Drag and drop data files onto the pane:

Major Components of Visual Preview
Visual Preview has options for toggling on and off several other windows to provide different ways of inspecting your data. You can do so using the buttons on the left side of the Visual Preview pane:
The Toggle Automatic Inspection on Selection button  lets you decide if data should automatically be displayed in Visual Preview when a cached object is selected. It is on by default.
The Open in Data Inspector button  opens the displayed data in Data Inspector.
The remaining buttons on the Visual Preview toolbar all toggle windows on and off. These windows replicate their function in Data Inspector.
The Toggle Graphics View button  controls the Graphics window, the area where spatial data is displayed.
The Toggle Display Control button  controls the Display Control window.
The Toggle Table View button  controls the Table view.
The Toggle Feature Information window button  controls the Feature Information window. Just like in Data Inspector, when you select a feature in the Graphics or Table View window, the Feature Information window shows information about that feature.